Talk to sales →

Data Analytics · Real-time reporting

Data analytics that tells you what's happening, as it happens

Real-time from your phone, native multi-channel attribution, GA4 and SEMrush integration, unified stock online + box-office and live entry rate. If the data arrives late, it no longer helps.

opera

Your data lives in 3 phases

Each one solves a different problem.

01 · Visibility

Watch your event live from your phone. Sales by the minute, occupancy by the second

02 · Attribution

Know which channel brought each ticket. Native attribution to GA4 and SEMrush without duplicate pixels

03 · Action

Turn the report into a decision. Export to your BI, open API and per-vertical reports

03 · VISUALIZE

Read your sales in real time

Make decisions with live data, not intuition.
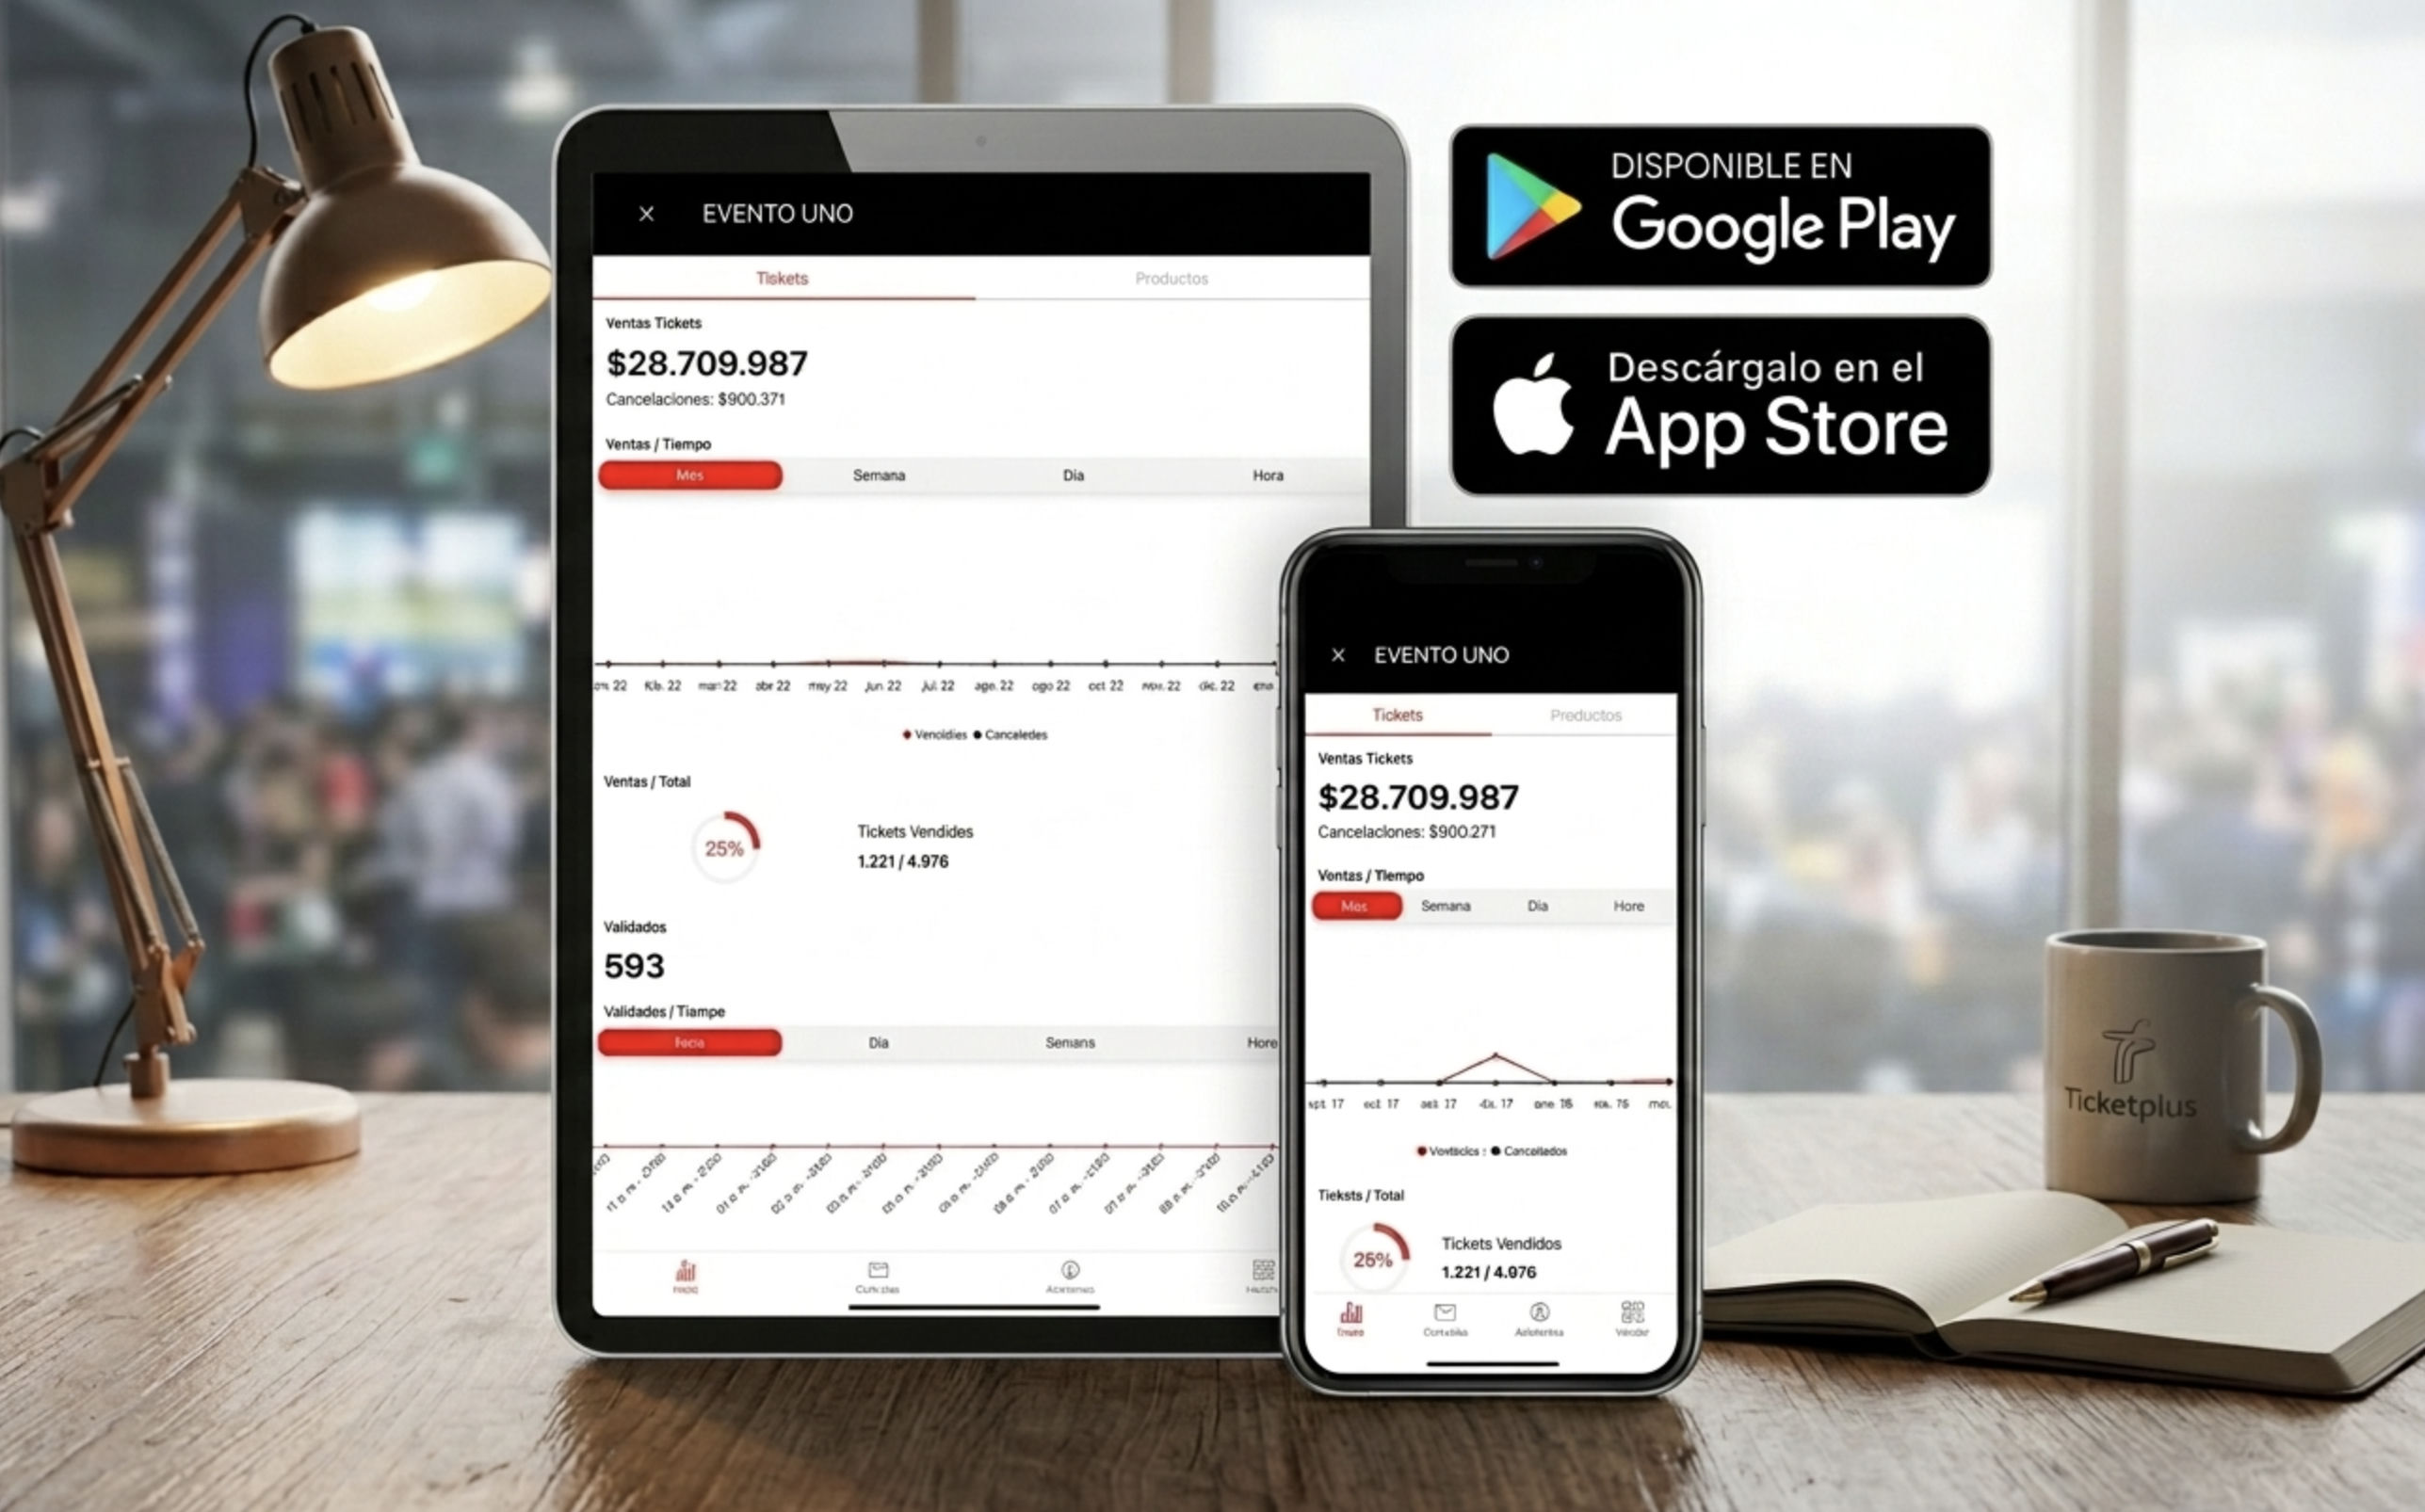
Ticketplus App Manager on tablet and smartphone over a desk showing sales, validated tickets and live charts
01 · App Manager

App Manager: your event in your pocket

View real-time sales, validate tickets and send comps from iOS and Android. For the producer who needs to watch the launch without opening a laptop.

01 · Live analytics

Live dashboards with channel attribution

Total revenue, by ticket type and by channel. Cross-event sales curve, live checkout conversion rate, per-minute sales during launches. End-to-end attribution from click to ticket sold.

02 · Business intelligence

Custom BI dashboard development

Plug into Looker, Tableau or Power BI. Data export for CRM and ERP. If your team doesn't have BI, we build custom dashboards for the KPIs you need to read. The business intelligence layer is yours.

Why Ticketplus Data

Dashboards with metrics that really matter.

The difference is not the number of charts. It's that data arrives on time, you can trust it, and you can export it.

Real-time at big data scale

Sales per minute even with +50K tickets/hour. <5s latency.

Native attribution, not an add-on

GA4 and SEMrush connected to TP's own pixel.

Frictionless export

CSV, XLSX, JSON, public API. The data is yours.

A report that gets used

Post-event, learn everything about your event

Let's talk about your reporting

Find a demo with a real event similar to yours

Dashboard demo in under 24 hours. No generic slides.

  • ✓ Demo with an event from your industry, not a generic demo
  • ✓ Sandbox access for your team for 7 days
  • ✓ Export and connector to your BI / data warehouse
  • ✓ Documented API with OAuth: zero mandatory commitment
  • ✓ Vertical-specific post-event reports
  • ✓ Native multi-channel attribution GA4 + SEMrush

Request a dashboard demo

We reply in under 24 business hours.

Loading form…